
While I was training my first networks, I ran into the problem of having to calculate, save and then plot all of the accuracies and losses per epoch. Because I wanted to focus on training, my plots weren’t the prettiest either. This is where I got the tip to use Tensorboard for displaying my results.
Tensorboard is TensorFlow’s visualization toolkit, with Tensorflow being one of the two most popular deep learning frameworks around. Tensorflow is now maintained open source, but was originally developed by the team at Google.
However, even though Tensorboard is intended as a toolkit for Tensorflow, you can also use it with the other big deep learning framework: Pytorch, which is particularly popular in academia and research. They have an official guide on their website for this as well.
Installation
Of course, you need to install pytorch and torchvision, which is described here. This could be as simple as
pip install torch torchvisionbut check the above link for the appropriate install link for your operating systems and version. You can also use conda if you prefer that over pip.
You also need to specifically install tensorflow:
pip install tensorboardLogging to Tensorboard and displaying results
The main class to use is SummaryWriter of which you create an instance near the start of your program:
from torch.utils.tensorboard import SummaryWriter
writer = SummaryWriter()
This writer will output its logs to the ./runs/ directory by default.
After you have run your code and if you do not need the writer anymore call its close() method.
writer.close()You can then see whatever you have logged in between (see below for specifics) by executing Tensorboard in your terminal:
tensorboard --logdir=runsHere you specify the path to the logging directory you used for your writer, which by default is ./runs/.
Logging Loss and Accuracy per Epoch
At least for me, one of the most common things I’m tracking are the loss and the achieved accuracy during each training epoch. Those are scalar values, so you use the add_scalar(tag, scalar_value, global_step=None, walltime=None) method of the SummaryWriter.
for epoch in range(EPOCHS):
    y_pred = model(x)
    loss = criterion(y_pred, y)
    writer.add_scalar("Train/Loss", loss, epoch)
    optimizer.zero_grad()
    loss.backward()
    optimizer.step()
The tag value has to be the same for every time you want to add a scalar to this collection – it is basically the name/identifier of the array.
Second value is the number that will be plotted on the y-axis and the third value is the x-axis number.
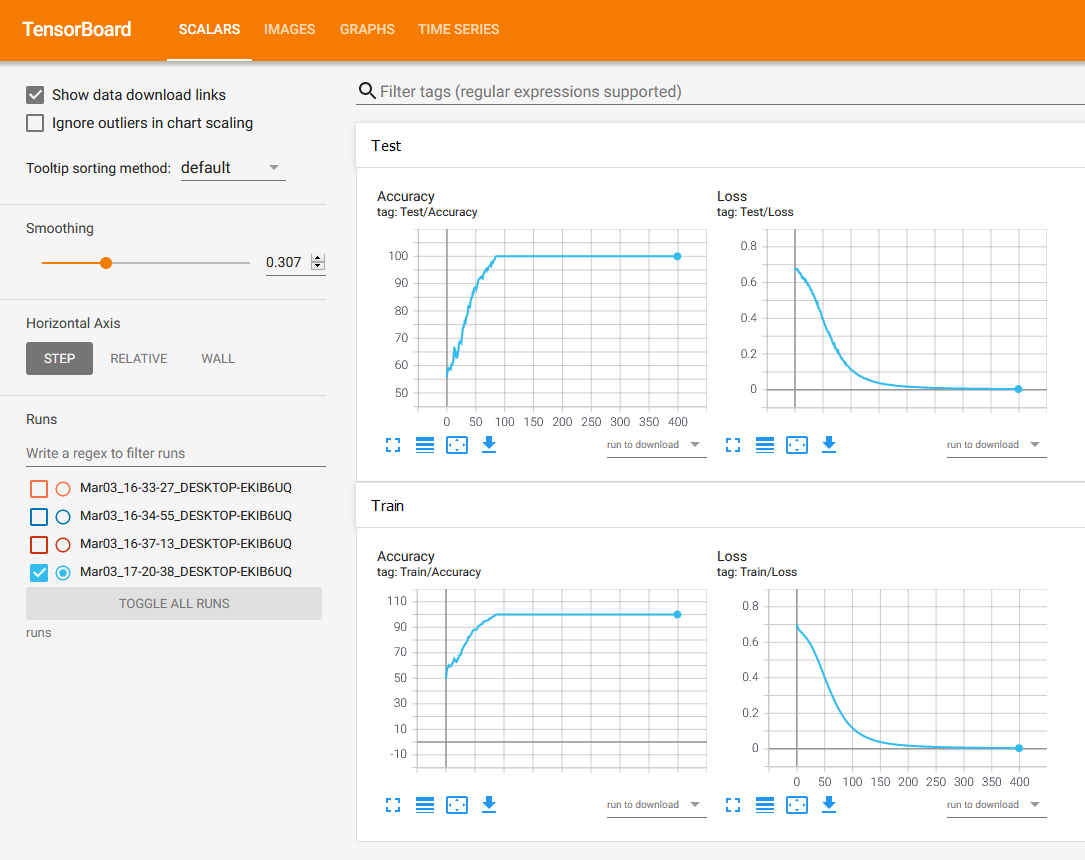
You can then compare the losses of different runs by selecting multiple runs on the left – they will then be shown in different colors in the same plot.
The plots are also interactive, you can hover over values and see concrete values as well as open a plot in fullscreen view and download the svg files of the plots if you want to save them or include them in your writing somewhere.
Axes: You can toggle between showing the y-axis in log-scale or normal. You can also change the x-axis between showing epoch numbers or relative time spent in training or absolute time (showing you the date and time that you trained the data).
Smoothing: Another useful feature is the smoothing slider on the left, with which you can control the amount of smoothing applied to the graphs.
Displaying the model architecture
As well as logging scalars, you can view your model as a graph and see input and output tensor sizes. This can be useful to debug or if you need a graphical overview of your model for a presentation or other visual media.
model = TwoLayerNet(INPUT_DIMENSION, NUMBER_OF_WEIGHTS)

example_input, example_value = train_dataset[0]
writer.add_graph(model, example_input)
To see your graph, simply add it to the writer instance of SummaryWriter (see above) by using writer.add_graph(model, example_input), where model is an instance of torch.nn.Module. You need to input a tensor as an example, because otherwise the graph can’t create the sizes of the intermediate tensors that is shows you in between components. This is not optional even though it says so in the documentation currently.
Remember that you can double-click on components to zoom in and see more internal details.

